Well, it’s time to publish the bike facts and statistics that we have been gathering for some time. We tried to find the freshest data possible and present it to you. There is lots of information from the 2000s, but not much from 2025. Nonetheless, we’ve managed to get a pretty nice selection of numbers, so let’s dive into the facts about bikes. 🙂
How Many Bikes Are There in the World?
Nobody knows exactly how many bikes exist in the world, but it is estimated that there are somewhere around 1 billion. It’s a huge number. For comparison, there are around 1.5 billion cars in the world.
At the end of the last century, the numbers were as follows:
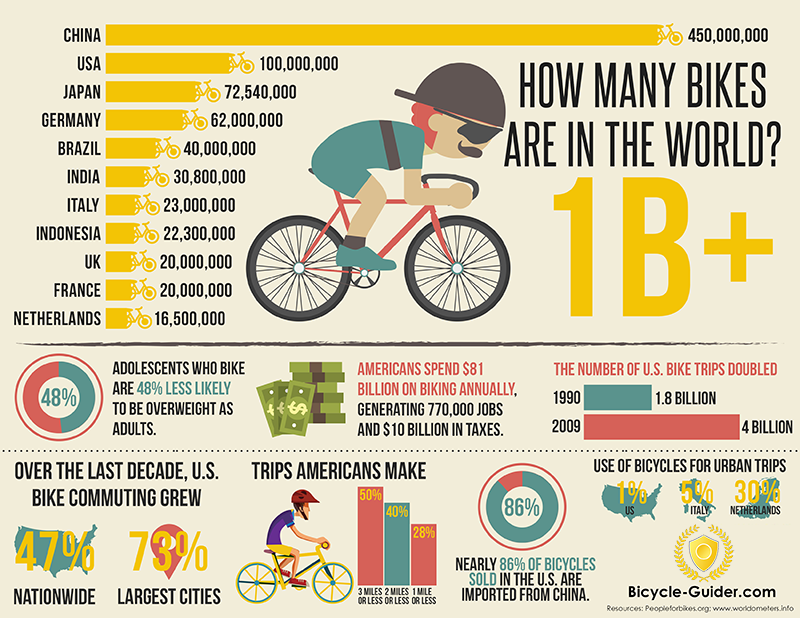
China is massively holding the first position. China, India, EU, Taiwan, and Japan are responsible for 87% of global production.
- 364,000 bicycles are produced daily. That’s 15,000 per hour, or 253 a minute, or 4 bikes a second.
- 47 670 bikes are being sold daily. Yes, every two seconds, someone will buy a bike.
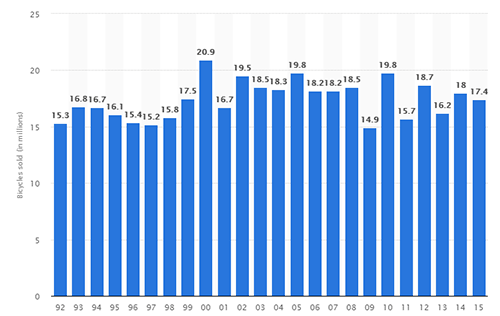
- Every 19th person in the world buys a bike each year.
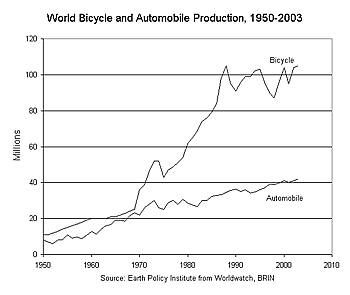
- The production numbers for bicycles are 2.5x higher than for cars.
- In 2016, Copenhagen announced that for the first time in history there were more bikes than cars on its streets. It has been one of Copenhagen’s top priorities to make the city bicycle-friendly, which proved to be a big success.
- The rise in the past 20 years has been 68%.
- In 2016, almost 20 million bicycles were sold in the European Union.
- However, in 2018, cycling made up just 1% of the total road traffic. For comparison, cars and taxis accounted for 77%.
- The percentage of children that walk or cycle to school has dropped from 82% to just 14% in the last 30 years, which is alarming.
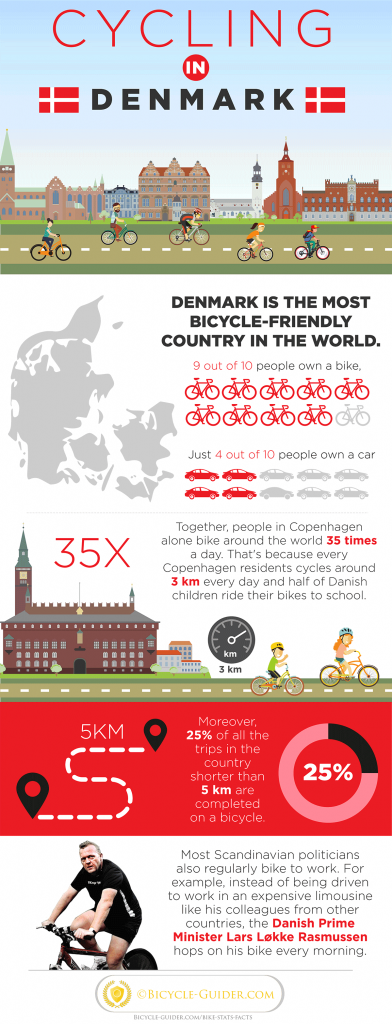
The country with the most cycling enthusiasts is Denmark. It’s pretty well known that Danish people love cycling and the cycling statistics prove it:
- Denmark is the most bicycle-friendly country in the world. 9 out of 10 people own a bike, whereas just 4 out of 10 people own a car.
- Together, people in Copenhagen alone bike around the world 35 times a day. That’s because every Copenhagen residents cycles around 3 km every day and half of Danish children ride their bikes to school.
- Moreover, 25% of all the trips in the country shorter than 5 km are completed on a bicycle.
- Most Scandinavian politicians also regularly bike to work. For example, instead of being driven to work in an expensive limousine like his colleagues from other countries, the Danish Prime Minister Lars Løkke Rasmussen hops on his bike every morning.
However, that also means that the number of bikes that get thrown away is on the rise as well.
- Around 15 million bikes end up discarded by their owners every year, according to gotjunk.com. Unfortunately, a large number of these bikes end up in landfills.
- China has a huge problem with old, discarded bicycles. There are not many recycling facilities around, so people just throw their unused bikes on piles.

- The European cities with the highest cycling rates are Copenhagen (49%), Amsterdam (35%), Helsinki (14%), Ljubljana (13%), and Berlin (13%).
- A bicycle commuter who rides 8km to work four days a week will save 750Kg of CO2 emissions in a year.
Contents
- How Has the Pandemic Changed the Bicycle Industry?
- Most Favorite Bike Types
- Bicycling From the Aspect of Money
- BIKE ECONOMICS (Numbers, numbers…)
- What’s the Estimated Size of the Bicycle Market in the US?
- Women
- HEALTH
- Cycling To Work Statistics 2025
- E-Bikes Statistics 2025
- Where and What Types of E-bikes Were Purchased?
- Why Cyclists Don’t Ride More?
- The Top 10 Cities With the Highest Bike Usage Rates in the US Are:
- Cycling Fatality Facts
How Has the Pandemic Changed the Bicycle Industry?
As we are all painfully aware, our lives have taken a turn in the past few years.
According to Statista, the amount of money spent on bicycles and accessories grew from $6 billion to $8.2 billion in the span of a year.
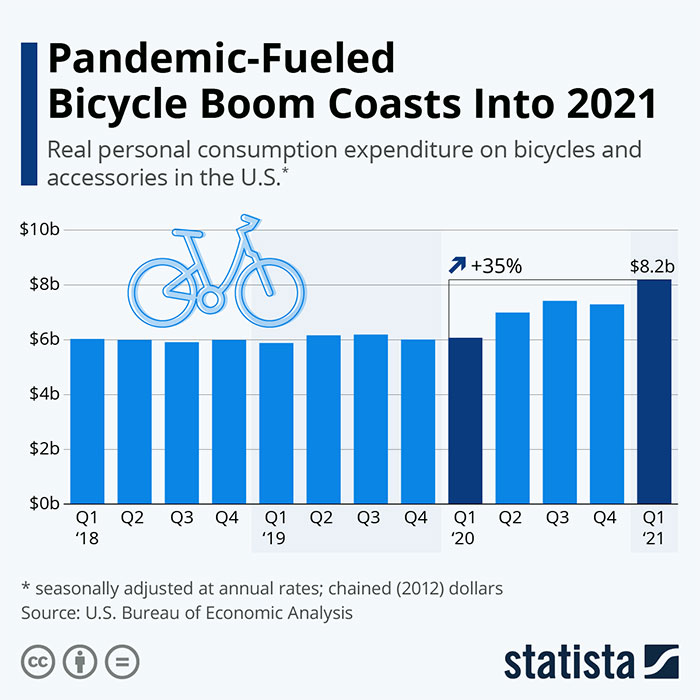
 The growth and pandemic combined led to another problem – a shortage of bikes. The “Bike Boom” as many called it, was a nuisance for both manufacturers and customers.
It’s was a combination of many factors:
- problems with shipping
- shortage of components
- lockdowns
- increased need for bikes, and so much more
Smaller stores took the hit too. For an LA bike shop, the bike sales grew 55% between December 2020 and February 2021 compared to the same period a year ago. As a result, bike prices went up quite a bit.
While the market has somewhat stabilized, there are new problems arising and keeping the prices up.
The war in Ukraine along with sanctions has caused the prices of raw materials and rising production costs to skyrocket in the bicycle industry chain (Source).
Most Favorite Bike Types
We ran a poll in three popular cycling groups, asking the members about their favorite bike types. Here are the results.
Cycling Fun – 9,800 members:
Global Cycling Network – 1,1M members:
Cycling Advice – 7,500 members:
Bicycling From the Aspect of Money
- According to Eurostat, Portugal exported 15% of all bicycles in 2016, making it the EU’s main bicycle exporter. It is followed by Italy (14%) and the Netherlands (13%). The total volume was 11 million bikes a year.
- On the other hand, the UK is the EU’s biggest importer of bikes, accounting for 18% of all imports.
- 92% of all exported bikes went to other EU members. The remaining 8% were exported to non-EU countries like Switzerland (15% of the remaining 8%), the USA – 11% and Russia – 7%.
Cycling instead of driving a car can also positively impact your personal finances:
- According to an AAA report, driving a small sedan costs around $6,777 a year. This is how much you will have to spend on gas, maintenance, and parts considering you’re driving around 15,000 miles a year.
- Riding a bike can help you save up to $1,200 a year on a gym membership. On average, gym membership in the USA costs between $30 and $100.
- A study conducted by INRIX calculated that annual parking costs in the US end up being around $3,000. That’s something you do not have to worry about when you’re riding a bicycle.
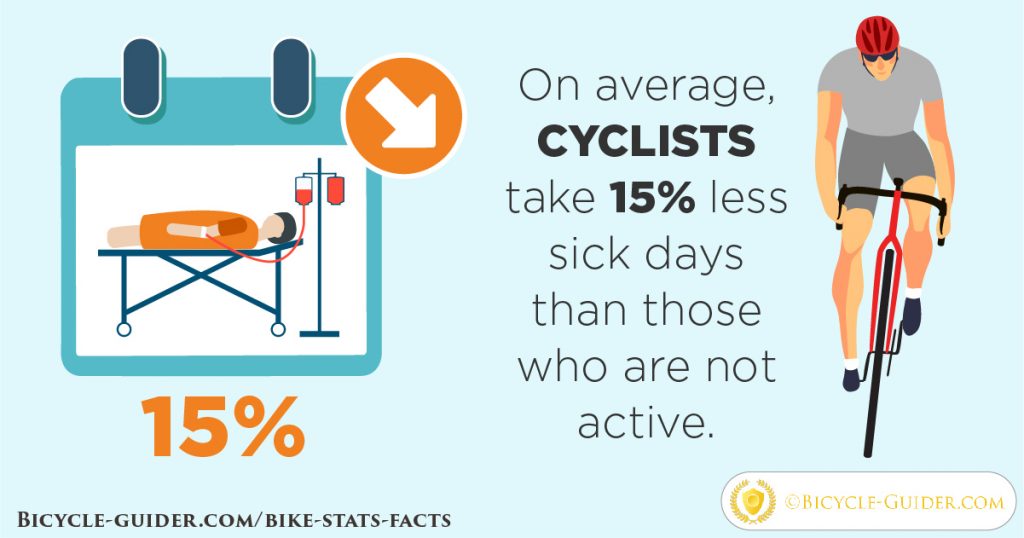
- A 2010 Dutch study revealed that people who cycle regularly take one day of sick leave less compared to those who don’t. In case your sick leave days are not compensated, that’s another day’s wage in your pocket.
- As part of the Emergency Economic Stabilization Act of 2008, employees should pay $20 a month to their employees who cycle to work. This money is tax-free as well!
- Cycling is excellent for the rural economy. A visiting cyclist will spend an average of £25/day on locally provided food and services. In contrast, a car-borne visitor will only spend £7.30
These are the 10 US cities with the highest parking prices, according to a study by Parking Property Advisors and Parkopedia. Riding a bike in these cities instead of driving would save you the most money:
- New York – $27
- Chicago – $17
- Boston – $16
- Philadelphia – $12
- Washington D.C. – $11
- Minneapolis – $10
- Los Angeles – $9.50
- Cleveland – $9
- Detroit – $9
- Denver – $8
If you’re wondering how much money you’d be able to save annually by cycling to work, you can use this calculator to come up with an approximate number. You’ll be surprised with the result!
BIKE ECONOMICS (Numbers, numbers…)
The cycling industry is simply huge and it’s constantly growing. Therefore, do not be surprised that the numbers below are going to be gargantuan as well.
What’s the Estimated Size of the Bicycle Market in the US?
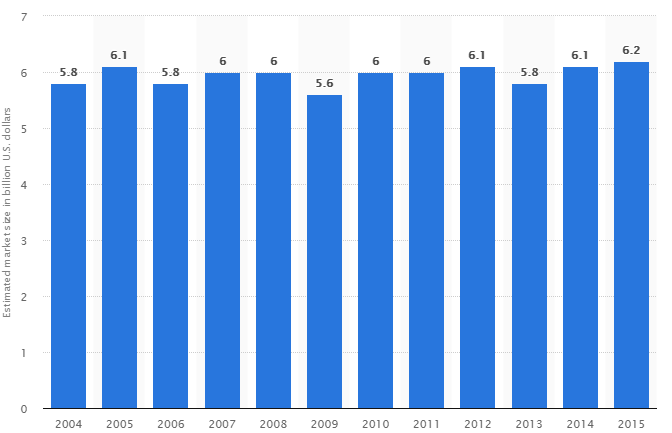
- In 2015, the US bicycle market was worth 6.2 billion dollars. That’s more than Albania’s yearly budget. With that money, you can add 4,133 Bugatti Veyrons to your garage.
- As of 2021, the money spent on bikes, accessories, and gear, went from $6 billion to a whopping $8.2 billion in the span of 4 quarters (that means it rose 35% in a year)
What does this number include? Retail sales of bicycles and related parts and accessories through all channels of distribution.
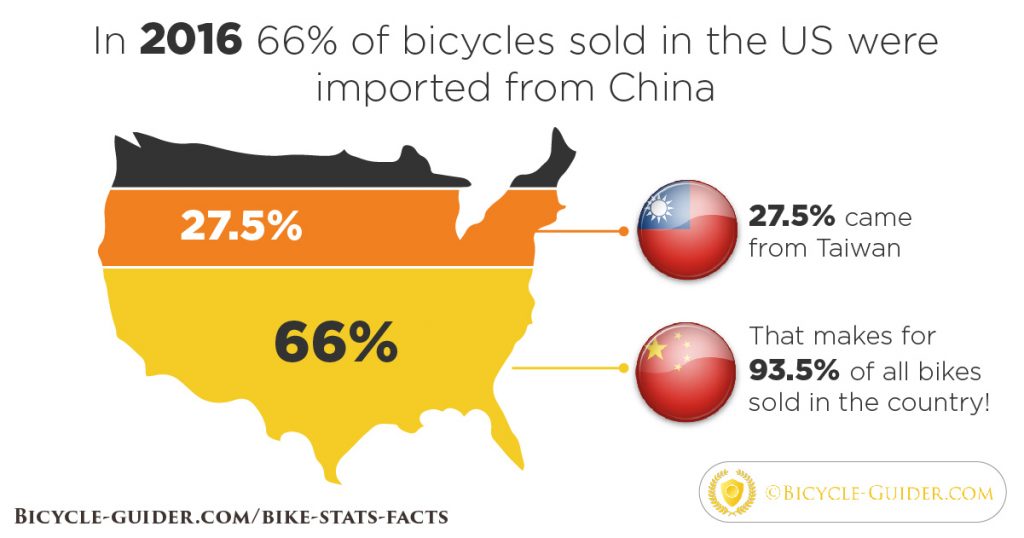
- According to Statista, bicycle expenses per consumer in 2015 were $23.02. That’s the highest in the period between 2007 and 2016. The year with the lowest expenses way 2009, with $13.69.
- Mountain bikes are the most popular type of bike ridden in the US (25%). They’re closely followed by hybrids (24%).
- Cycling is most popular in the western US states and least popular in the southern states.
- According to Special Eurobarometer, the three main reasons why the Europeans cycle are convenience (49%), speed (27%), and price (24%).
Women
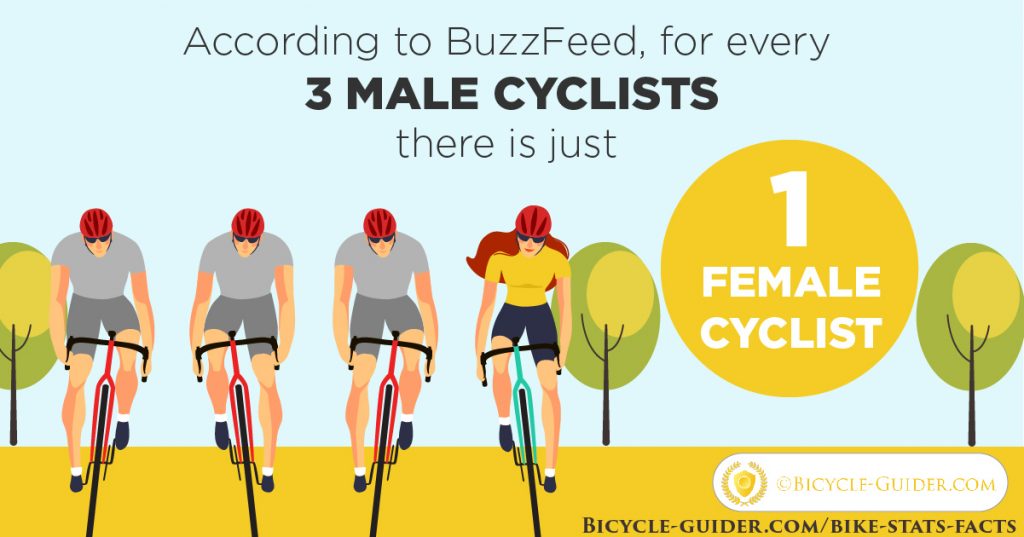
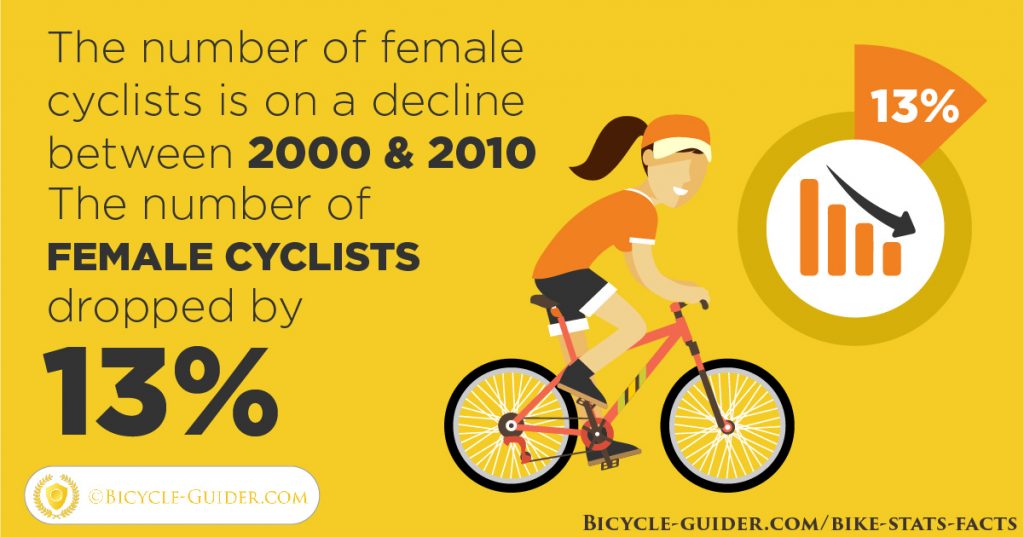
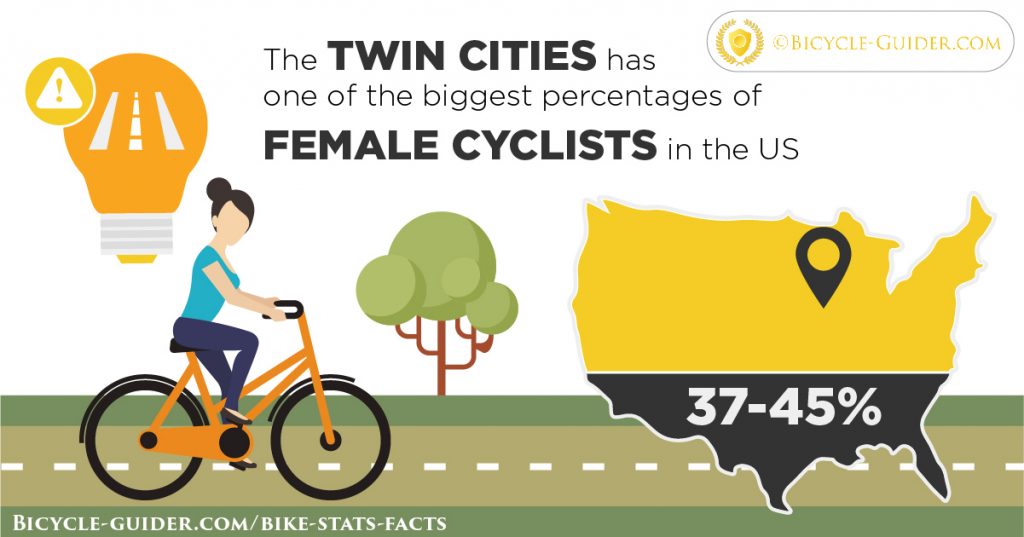
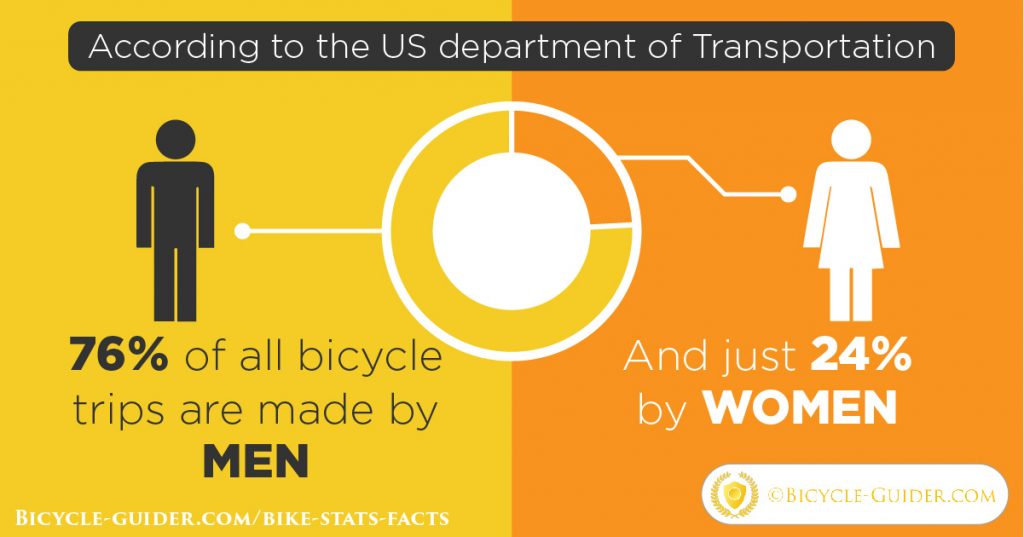
Unfortunately, women still do not take up cycling as much as men. Here are some interesting facts that help us understand this situation better:
Bicycle tourism also plays an important role when considering the size of the market:
- Mountain bikers spend $30.2 million annually in the Nantahala and Pisgah National Forests, a research conducted by the Outdoor Alliance in 2017 showed.
- Bicycling generates $137 million per year in Northwest Arkansas. That makes it a regional economic engine.
- In Wisconsin, the cycling industry accounts for 3,420 jobs and generates $556 million in revenue.
How Much Did the Accell Group Earn?
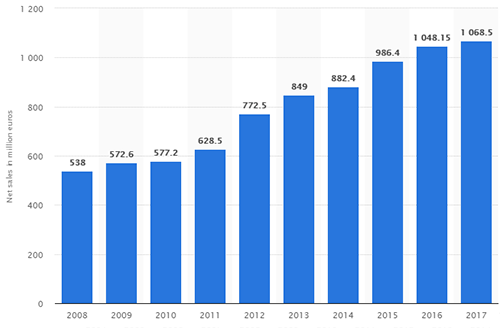
The Accell Group includes different bike manufacturers such as Diamondback, Raleigh, Ghost, and others. In 2017, they made $1,06 billion in sales.
Accell’s net sales from FYI 2008 to FY 2017 (in million euros)
HEALTH
As you know, cycling is not only good for economics. It’s one of the best ways to exercise and stay healthy as well. It can help you lose weight and get fit, on top of getting you from point A to point B. It truly sounds like the perfect activity to do if you need any of these results.
Here are some interesting cycling health facts we’ve picked out that will tell you more about it:
- Cycling’s health benefits greatly outweigh the risks! By cycling instead of driving a car, you can prolong your life by 3-14 months, whereas increased inhaling of air pollution and increased risk of accident only diminish your life span by a maximum of 49 days.
- Cyclists breathe in about 60% less air pollution than motorists. Even though cyclists breathe two to three times more, they breathe in less pollutants.
- A study from 2006 shows that cyclists are exposed to fewer pollutants than even taxi and bus passengers.
- Children’s cardiovascular system greatly improves when they ride a bike to school daily.
If this is not enough to convince you to start cycling, you should know that riding a bike can protect you from diseases and prolong your life:
- Adults who ride a bike regularly suffer from fewer age-related health issues.
- Cycling regularly can reduce the rate of all-cause mortality by 10%.
- Cycling is associated with a decreased risk of type II diabetes. The elderly people benefit the most, experiencing a 20% reduction in the risk of developing this health condition.
- According to a report, the city of Portland, Oregon saves $115 million a year in healthcare costs thanks to benefits from cycling.
- Data shows that the health benefits achieved through Barcelona’s bike-sharing program outweigh the risks 77:1.
- A study in England concluded that the average cyclist has the fitness of someone 10 years younger and a two-year higher life expectancy compared to the average.
- Apart from physical benefits, cycling also improves mental well-being. A study from England shows that cycling improves self-confidence and tolerance to stress while reducing sleep issues and tiredness.
- On average, people exercise longer when they are outside than in a gym.
- Research in Ireland shows that 80% of participants with osteoarthritis experienced relief after they started cycling regularly.
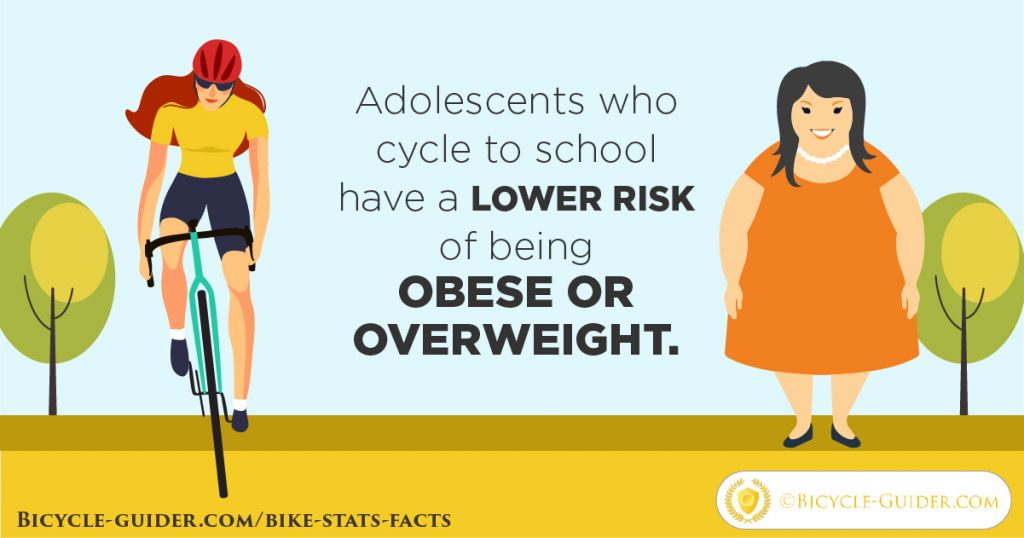
- Countries with the highest rates of cycling and walking have the lowest rates of obesity.
- Riding a bike between 30-60 minutes a day is associated with lower blood pressure numbers in both men and women.
- Women who ride a bike for a minimum of 30 minutes a day have a lower risk of breast cancer.
Cycling To Work Statistics 2025
Are you thinking about riding your bike to work? You might have heard some horror stories, but most of them are not true. In reality, the benefits of cycling to work greatly outweigh the potential risks, that’s something numerous studies show.
For some additional convincing, check out these interesting facts that we have found about riding your bike to work:
- The European Cycling Federation found that cyclists emit 21 g of CO2 per kilometer, while cars emit 271 grams.
- By riding a bus, you will emit 101 g of CO2. So a 10-mile home-work-home bicycle commute saves our world from 9 pounds of CO2 every day.
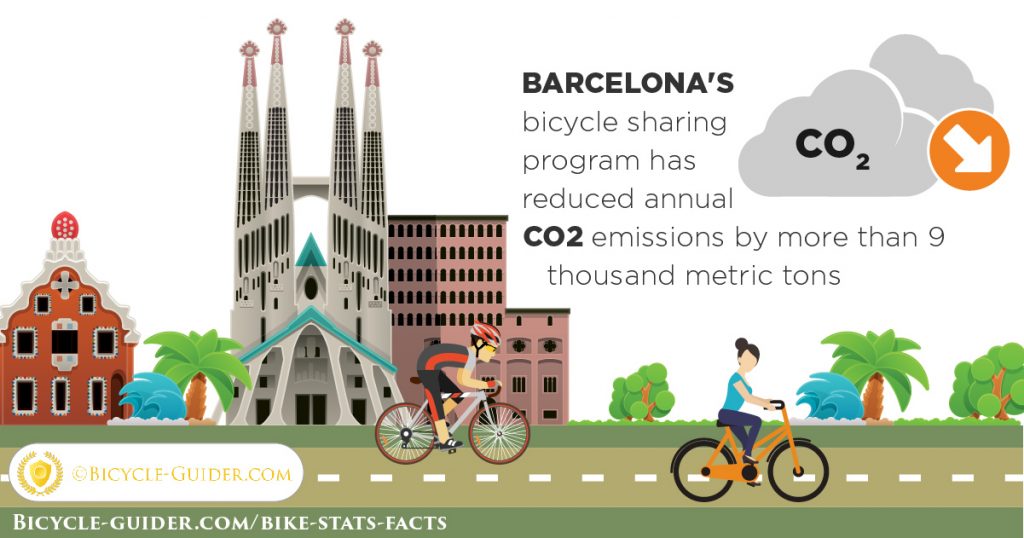
- Copenhagen’s love of cycling prevents 90 thousand tons of CO2 from entering the atmosphere every year.
- 60% of people in England who are able to ride a bike reported that they do not cycle because they find the traffic dangerous.
- Cycling UK found that cycling to work means you can expect a 45% lower risk of developing cancer, as well as a 46% lower risk of cardiovascular disease.
But riding to work has many other implications as well:
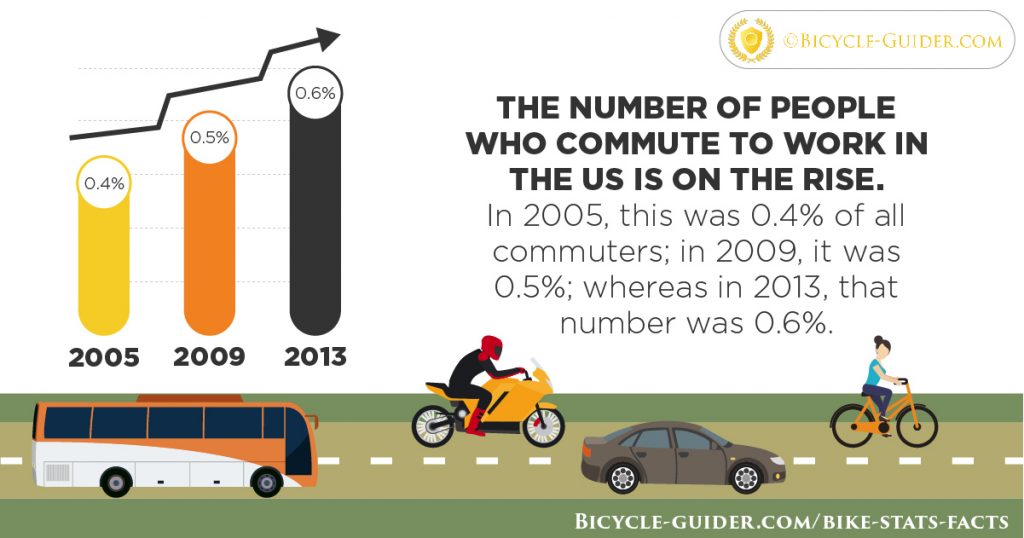
- People who commute longer sleep less, according to a 2012 study. In urban areas, you can shorten your commute by cycling and have more time to sleep.
- The majority of people who do not cycle to work report they’d reconsider it if the cycling infrastructure was better.
- People who commute by car are at more risk of gaining weight even if they exercise regularly, compared to those who commute by bicycle.
- On average, cities with high cycling rates have lower rates of accidents for all modes of transportation.
- A US study showed that a 1% increase in the length of bike lanes leads to a 0.31% increase of people who ride their bikes to work. Thus, more bike lanes means more bike commuters.
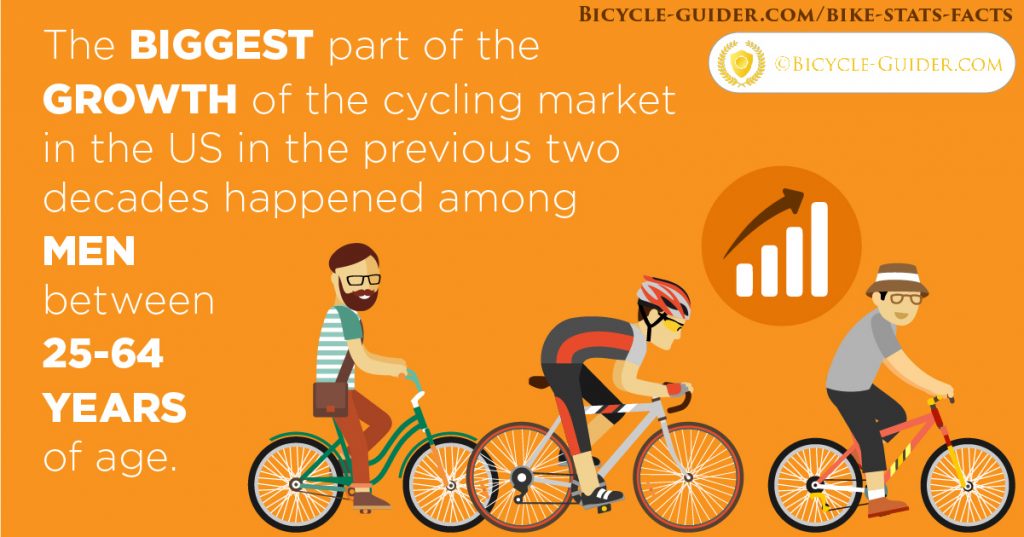
- More people commute to work by bicycle if they have dedicated bicycle parking spots and a shower at their office. However, only 15% of those who commute by bicycle report that their employers provide bike facilities.
- The average bike commute in New York City takes 35 minutes
- Employees with a flexible work schedule are more likely to ride their bikes to work than those on a fixed schedule.
- According to research conducted among British bike commuters, 40% of them ride to work for health, 30% due to fuel prices, and 7% to lower their impact on the environment.
- Mountain bikes are the most popular choice of commuters in the USA (30%). Road bikes (28%), hybrids (18%), and touring bikes (17%) follow.
- The average price of a bike used for commuting in the US is $687.
- The average bike commuter has been riding their bike to work for 8.3 years.
Have you ever wondered which US cities have the highest numbers of bike commuters? Here are the top 10 according to the League of American Bicyclists:
- Portland – 7%
- Minneapolis – 5%
- San Francisco – 4.3%
- Washington D.C. – 4.1%
- Seattle – 4%
- New Orleans – 3.3%
- Oakland – 2.9%
- Tuscan – 2.4%
- Philadelphia – 2.2%
- Denver – 2.1%
E-Bikes Statistics 2025
Portland State University did a great research which we are going to cover in this section. To gather the information, they asked 1,784 e-bike owners all over the US.
How Many Bikes Are Converted to E-bikes?
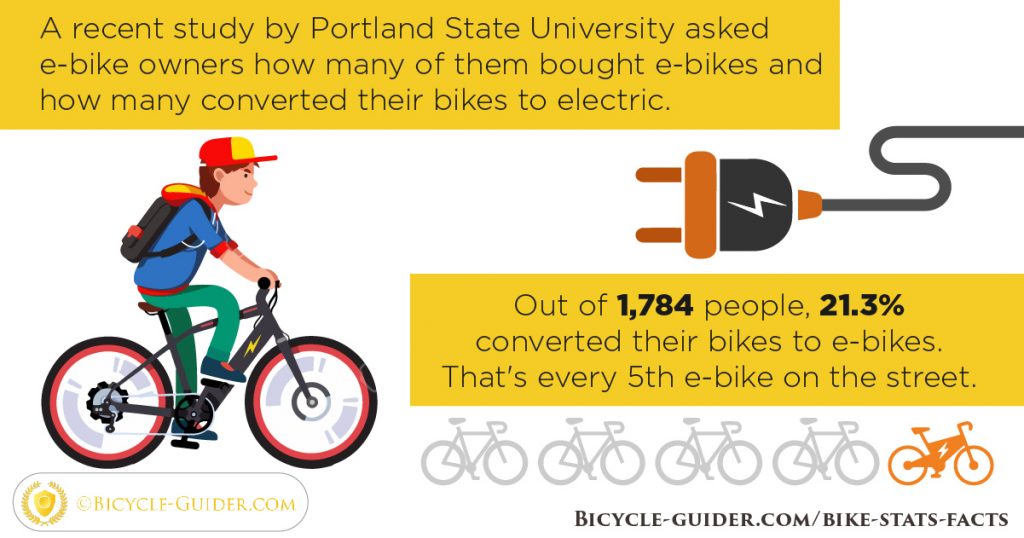
We believe this number is declining because e-bike prices are going down each year.
Where and What Types of E-bikes Were Purchased?
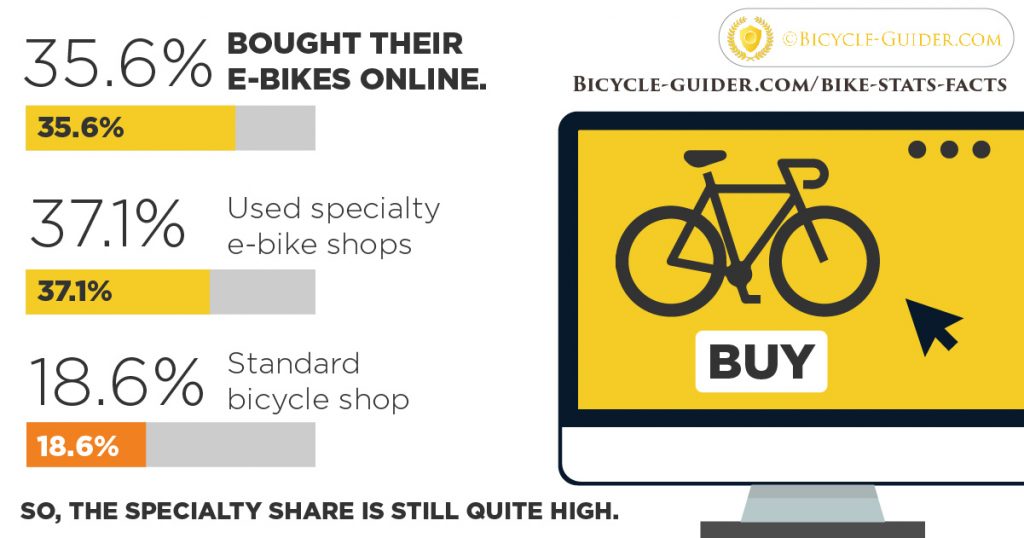
Even More Fun Electric Bike Facts and Statistics
- According to the League of American Bicyclists, only 31% of riders have ever ridden an electric bicycle. 12% have never even seen an electric bike in their life.
- A study conducted in Tennessee concluded that e-bike riders pay just as much attention to safety as regular cyclists.
- According to Portland State University, the majority of riders buy e-bikes to increase their range and speed. The second most common reason is to ride more easily on hills.
- 80% of respondents in a research conducted by Bike League said they believe e-bikes have positive aspects.
- The majority of negative perceptions of e-bikes are related to safety issues.
- E-bike sales have surpassed sales of regular bicycles in the Netherlands. Between 2017 and 2018, the e-bike market grew by 9%.
- In China, around 36 million e-bikes are manufactured in a year.
- In England, 65% of electric bikes sold are bought by individuals aged 55 and over.
- A study in Norway showed that people who obtained an e-bike increased their cycling trips from 28% to 48%.
- On average, electric bikes are 10 kg heavier than regular bikes.
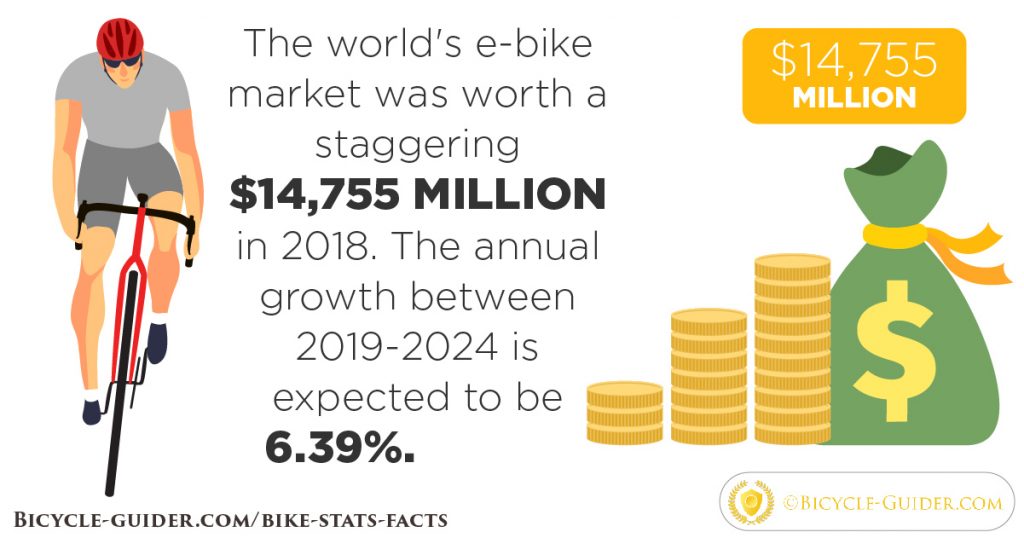
- In 2018, 88.32% of all e-bikes in the world were pedal-assisted e-bikes.
- In the European Union, e-bikes are most popular in Germany, the Netherlands, France, and Italy.
These Are the Five Biggest E-bicycle Manufacturers in the World, According to Numbers:
- Giant Bicycles
- Yamaha Bicycles
- Trek Bikes
- Merida Industry Co. Ltd
- Fritzmeier Systems
Where do EU countries import their bikes from?
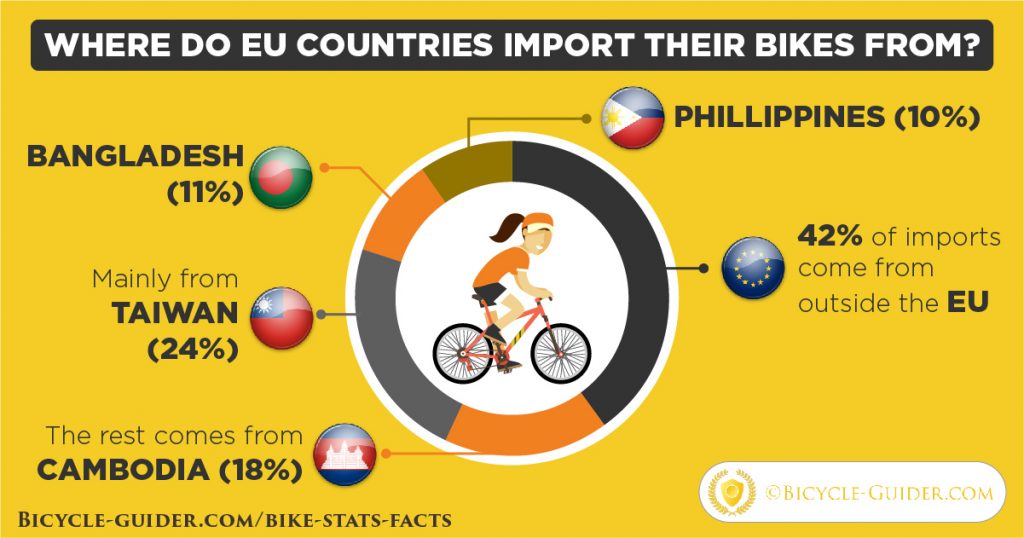
Why Cyclists Don’t Ride More?
What are the three reasons why bike owners don’t ride more? The answers of 1,755 respondents were quite interesting:
- Hills
- Lengthy distances
- Arriving at a destination drenched in sweat
Interesting results? That might be the reason why cycling to work isn’t as popular as we would like it to be.
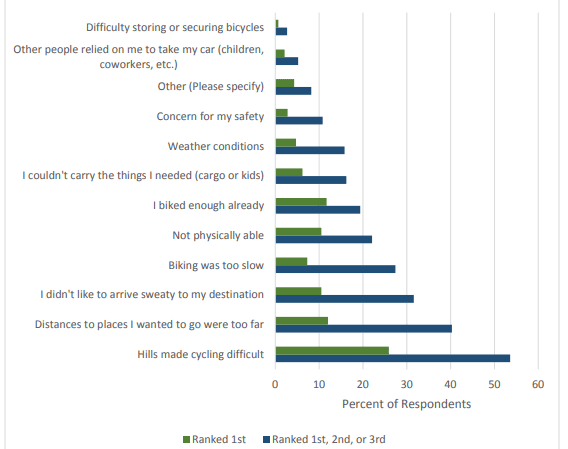
Let’s see some other popular answers as well:
4. Biking is too slow
5. Not physically able to ride a bike
6. I biked enough already
7. I couldn’t carry the things I need (cargo or kids)
What’s surprising is the fact that the difficulty of storing or securing bicycles was the least popular answer. It means that people feel that their bikes are safe when locked.
However, bicycle theft statistics show a different reality. But, let’s see what the numbers actually say.
Here you can find more electric bike facts and statistics
How Many Bikes Are Stolen Daily in the UK?
Bikes are fairly easy to steal and resell. But these are not the only reasons why huge numbers of bikes are stolen. The main reason is that they are actually not locked properly.
So, according to cyclist.co.uk, 400,000 bikes are stolen each year in the UK. That makes for 1,100 bikes a day or 2 bikes in three minutes. Sidenote: That’s a lot more than in the US.
What are the top 10 cities in the UK with the highest bicycle theft rates?

The others are Manchester, Cambridge, Cardiff, Bournemouth, and Reading.
How Many Bikes Are Stolen Daily in the US?
According to Markel Insurance, 188,500 bikes are stolen each year in the US. That’s half as much as in the UK. However, that makes for 516 bikes stolen every single day and one bike every 3 minutes.
What Are the Top 10 American Cities With the Highest Bicycle Theft Rates?
Where are the “sweetspots”? Let’s see the top 10 cities and then compare it with cycling rates.
Top 10 American cities with the highest bike theft rates according to thebestbikelock.com are:
- Philadelphia, PA
- Chicago, IL
- New York City, NY
- San Francisco, CA
- Tucson, AZ
Followed by Portland (OR); Denver (CO); New Haven (CT), Cambridge (MA), and Austin (TX).
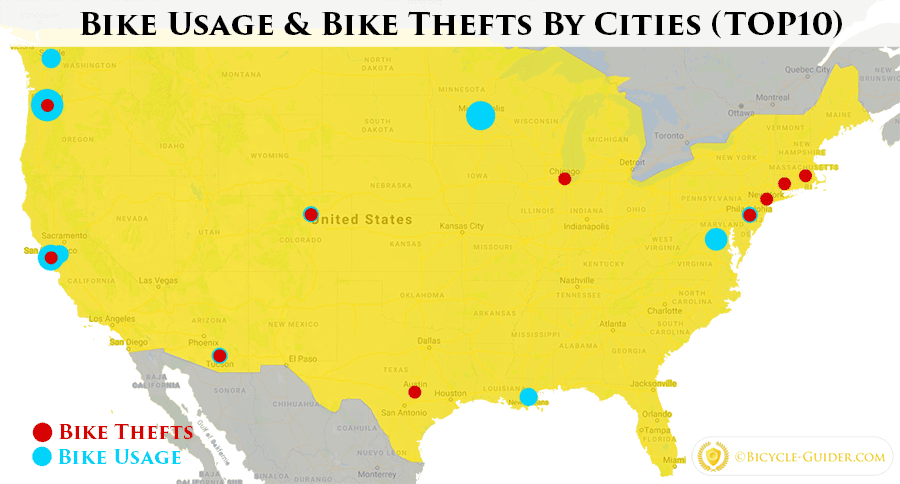
Let’s have a look at the bike usage as well.
The Top 10 Cities With the Highest Bike Usage Rates in the US Are:
See full data on Bikeleague.org. (2015)
As you can see, some of the cities with the highest usage rates do not have high theft levels at all. And vice versa. Security is crucial!
What Bike Brands Are the Most Stolen Ones (In the UK)?
.As you can see, the top five brands make 76.4% of all the stolen bikes. Moreover, the top 3 make almost 60% of the bikes stolen in the UK. That comes as no surprise because these are the most popular brands in the UK as well.
The full report is available on road.cc
What Were the Most Popular Stolen Bikes in the UK?
If we dig deeper, then we come up with these results. You might think that they would be cheap Mongooses, but here are the results:
- Specialized Sirrus
- Specialized Alles
- Carrera Subway
- Specialized Rockhopper
- Specialized Hardrock
- Brompton M3L
- Specialized Langster
- Specialized Crosstrail
- Ridgeback Velocity
- Specialized Vita
The more bikes on the road, the easier it is to sell a stolen one. We believe that thieves go for less-distinctive bikes.
Wow, the average price is quite high according to that information.
The Lowdown of Cycling in Denmark
Cycling Fatality Facts
We’d love to have no stats to show in this section. Unfortunately, cycling fatalities are a tough reality. The data provided by the U.S. Department of Transportation’s Fatality Analysis Reporting System (FARS) shows how grim the stats are.
The good news is that child cyclist deaths have declined in recent years. The bad news is that deaths among adult cyclists have tripled since 1975.
Here are some other facts that will spread awareness of the importance of safety precautions when cycling:
- A big cause of cyclist deaths is injuries to the head. Therefore, the importance of wearing a bicycle helmet whenever you get on the bike is clear.
- 61% of cyclists who were killed, were not wearing a helmet.
- Alcohol is a significant factor as well. 20% of cyclists aged 20+, who were killed in 2018 had blood alcohol concentrations higher than 0.08 percent.
- In 2018, a total of 854 bicyclists were killed in crashes with other vehicles. That represents 2% of all motor vehicle crash deaths and a 7% increase from 2017.
- Bicyclist deaths have reached their lowest point in 2010, but have increased to 38% since then.
- Deaths of cyclists aged 20 and below have declined 89% since 1975.
By analyzing cycling fatalities by age and gender, cycling statistics show that males are at much higher risk:
- Data collected since 1975 shows that more male than female fatalities has been recorded every single year.
- In 1975, there were 180 fatalities recorded of male cyclists older than 20. In 2018, that number rose to a record high of 651.
- Comparatively, the number of female cyclist fatalities in 1975 was 32. In 2018, the number reached 93. That’s a decline from the 2016 all-time high of 112.
Part of the year and time of the day also affect cycling fatalities:
- In 2018, cyclist deaths were highest in September at 12%. They were lowest in March at 5%.
- Data from 2018 shows that the risk of cycling-related fatalities is the highest between June and October.
- Cyclist fatalities were highest between 6 pm and 9 pm in 2018. 21% of deaths occurred at this time.
- During the daytime, the lowest risk of bicyclist deaths is between 9 am and noon — 10%.
Of course, where you ride also affects how much at risk you will be in traffic. Urban areas are generally much more perilous than rural areas.
- In 2018, 79% of cyclist fatalities occurred in urban areas. In 1975, the distribution between urban and rural areas was equal.
- Within urban areas, intersections are the highest-risk places. In 2018, 37% of deaths occurred at intersections.
- As expected, the number of cyclist deaths is much higher on major roads than on minor ones — 63% compared to 29% in 2018.
So, the main takeaway is to always wear a helmet, never drink and ride, and exert the most caution when crossing intersections. These are the biggest contributors to cycling-related fatalities.
Let’s do a joint effort to change these facts for the better in the following years!
Hope you enjoyed it!
 Feel free to share it below with your readers & friends!
We will update it whenever there’s some fresh information!
Keep in mind that the images are copyrighted (if not stated differently). You can use them if you link back to this source.
Other resources and stats used on this page
- https://www.worldometers.info/bicycles/
- https://www.statista.com/statistics/236152/us-unit-sales-of-bicycles/
- https://www.theguardian.com/cities/2016/nov/30/cycling-revolution-bikes-outnumber-cars-first-time-copenhagen-denmark
- https://ec.europa.eu/eurostat/en/web/products-eurostat-news/-/EDN-20170612-1
- https://ppms.trec.pdx.edu/media/project_files/NITC_RR_1041_North_American_Survey_Electric_Bicycle_Owners.pdf
- https://www.moneyunder30.com/car-free
- https://inrix.com/press-releases/cod-us/
- https://www.bizjournals.com/bizwomen/news/latest-news/2018/04/the-cost-of-parking-may-surprise-you.html
- https://www.ncbi.nlm.nih.gov/pubmed/20580736
- https://www.outdooralliance.org/blog/2017/10/4/the-nantahala-and-pisgah-national-forests-an-economic-powerhouse-for-western-north-carolina-1
- https://www.waltonfamilyfoundation.org/about-us/newsroom/bicycling-provides-137-million-in-economic-benefits-to-northwest-arkansas
- https://wisconsindot.gov/Documents/projects/multimodal/bike/econ-impact.pdf
- https://vtpi.org/pucher3.pdf
- https://www.tandfonline.com/doi/abs/10.1080/15568318.2012.673694#.UemxWD5xuJM
- https://www.ncbi.nlm.nih.gov/pubmed/7591177
- https://www.ncbi.nlm.nih.gov/pmc/articles/PMC2920084/
- https://onlinelibrary.wiley.com/doi/full/10.1111/acel.12750
- https://www.ncbi.nlm.nih.gov/pubmed/21816732
- https://www.cycle-helmets.com/cycling_and_health.pdf
- https://www.ncbi.nlm.nih.gov/pubmed/11338130
- https://peopleforbikes.org/our-work/statistics/
- https://www.rospa.com/rospaweb/docs/advice-services/road-safety/cyclists/e-bikes-factsheet.pdf
- https://www.mordorintelligence.com/industry-reports/e-bike-market
- https://www.cyclinguk.org/statistics
- https://ecf.com/resources/cycling-facts-and-figures
- https://www.statista.com/chart/25088/us-consumer-spending-on-bicycles/
- https://www.bbc.com/future/bespoke/made-on-earth/the-great-bicycle-boom-of-2020.html
- https://www.cbsnews.com/news/bike-shortage-nationwide-coronavirus-pandemic/


Great JOB!!!
Thank you, Michael!
your site is very useful for my facts
Thanks!